How to calculate your churn rate
Before comparing to benchmarks, make sure you're calculating churn the same way the benchmarks do. There are two common formulas:
Customer churn rate
(Customers lost in period) ÷ (Customers at start of period) × 100
Simple to calculate. Treats a $10/mo and a $500/mo cancellation identically — which can mask revenue impact.
MRR churn rate (recommended)
(MRR lost to cancellations + downgrades) ÷ (MRR at start of period) × 100
Revenue-weighted. This is the benchmark most investors and SaaS analysts use. Downgrades count; upgrades don't (that's NRR).
Most of the benchmarks below use MRR churn rate. If you're comparing your numbers, make sure you're using the same definition.
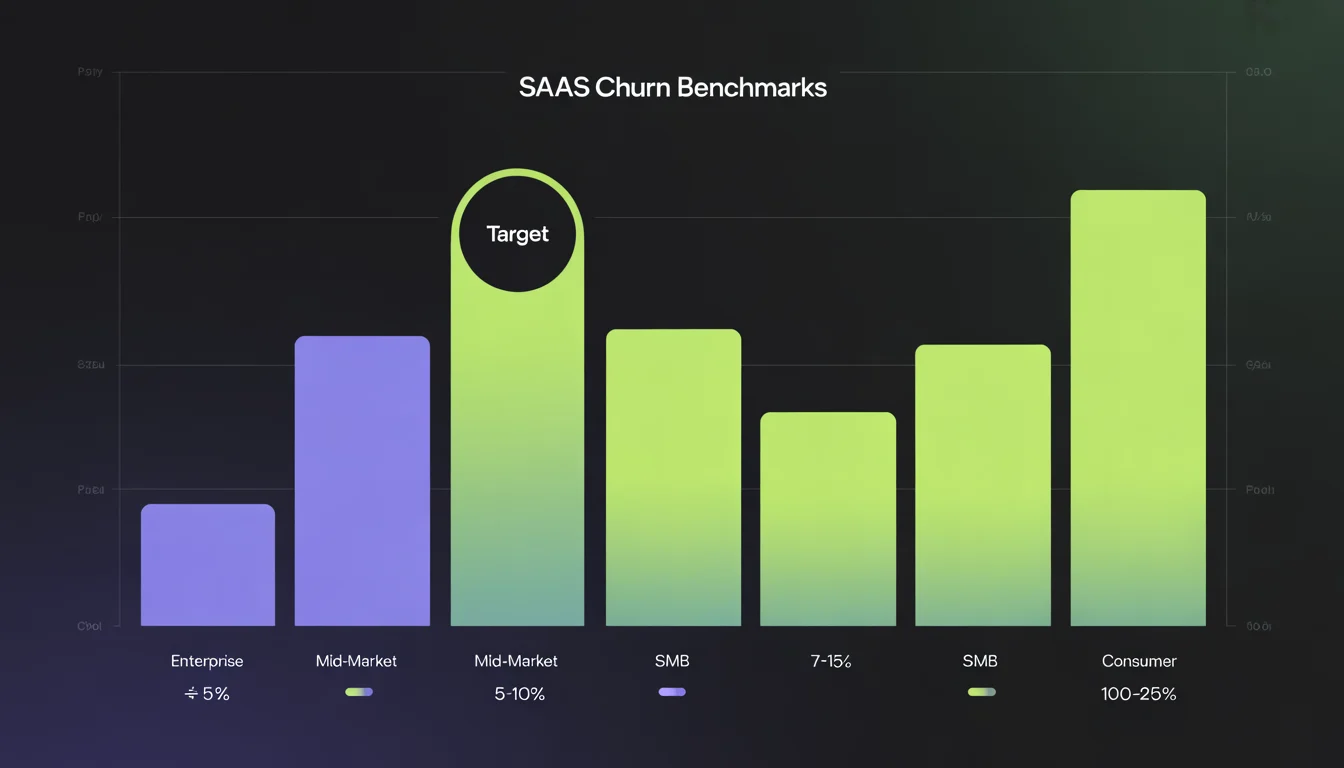
Benchmarks by customer segment
Customer segment is the single biggest driver of what "normal" churn looks like. Enterprise SaaS and consumer SaaS can have 10× different churn rates and both be healthy businesses.
Enterprise (ACV > $50K)
< 5%
annual / < 0.4% monthly
Mission-critical tools with high switching costs. Churn is often driven by budget cuts or company-wide decisions, not product.
Mid-market (ACV $5K–50K)
5–10%
annual / 0.4–0.9% monthly
Moderate switching costs. Churn is a mix of product fit, competitive pressure, and budget reviews.
SMB (ACV < $5K)
7–15%
annual / 0.6–1.3% monthly
Lower switching costs, higher price sensitivity. Payment failures (involuntary churn) are more common and often underestimated.
Consumer / PLG (free-paid)
10–25%
annual / 0.9–2.3% monthly
Highest churn benchmarks. Monthly billing, low ticket prices, and higher impulse cancellations. Involuntary churn is proportionally larger.
Benchmarks by ARR band
Churn benchmarks also shift with company stage. Earlier-stage companies have higher expected churn as they work out ICP fit; later-stage companies should have tighter retention.
| ARR band | Target churn | Context |
|---|---|---|
| $0 – $100K ARR | < 15% annual | Pre-PMF. High churn is expected; focus is on learning what makes customers stay, not optimising retention metrics. |
| $100K – $1M ARR | < 10% annual | Early growth. Churn drops as ICP becomes clearer. Involuntary churn is already worth fixing at this stage. |
| $1M – $5M ARR | < 7% annual | Scaling. Churn is a key metric for investors. Payment recovery and cancel flow tooling typically pays for itself here. |
| $5M – $20M ARR | < 5% annual | Growth stage. Churn above 5% annually becomes a significant drag on net revenue retention and valuation multiples. |
| $20M+ ARR | < 3% annual | Scale. Best-in-class companies at this stage run negative net churn (expansion > churn). 3% gross churn is the benchmark. |
Churn rates by industry (annual)
Industry context matters. A 10% annual churn rate is alarming for a financial services SaaS and completely normal for a consumer e-learning tool.
| Industry | Annual churn range | Key driver |
|---|---|---|
| Financial services / FinTech | 2–4% | High switching costs, compliance inertia |
| HR & payroll software | 3–6% | Deep integrations increase stickiness |
| Developer tools | 4–8% | PLG models push rates higher |
| Marketing / CRM | 6–12% | Competitive market, frequent re-evaluation |
| Project management | 5–10% | High competition, easy to switch |
| E-learning / EdTech | 8–20% | High impulse purchase rates and seasonal patterns |
| Consumer subscriptions | 10–30% | Monthly billing, low commitment |
Voluntary vs involuntary churn: the split most founders miss
Churn benchmarks almost always combine two fundamentally different problems: customers who chose to leave (voluntary) and customers whose payment failed (involuntary). They require different solutions.
Voluntary churn
Customer actively cancels. Requires product improvements, better onboarding, cancel flow intervention.
Share: 60–80% of total churn
Involuntary churn
Payment failure causes lapse. Requires dunning sequences, smart retries, expiring card alerts. Largely recoverable.
Share: 20–40% of total churn
If your churn is 8% annually and 30% of that is involuntary, you have 2.4 percentage points that are recoverable without any product changes — just better billing infrastructure. That's a material improvement for a fraction of the effort of reducing voluntary churn.
Red flags: when to investigate
⚠ Churn spike without a product change
Sudden spikes in churn without an obvious product cause often indicate a billing infrastructure issue — a configuration change that broke payment retries, or a card processor change.
⚠ High share of 'cancelled' subscriptions with no cancel event
If cohort analysis shows subscriptions lapsing without a user-initiated cancel event, you're looking at involuntary churn that your metrics are quietly absorbing.
⚠ Your churn rate is higher than your customer acquisition rate
If you're acquiring 8% new customers per month but churning 10%, you're in a leaky bucket situation. No growth amount fixes a fundamental retention problem.
⚠ SMB churn above 15% annually
15% annual MRR churn for SMB SaaS suggests both voluntary (product fit) and involuntary (payment infrastructure) problems. Both need addressing simultaneously.
⚠ Monthly billing churn significantly higher than annual billing
A large gap between monthly and annual subscriber churn rates (beyond the expected 2–3×) suggests price sensitivity or value perception issues at the monthly price point.
How to improve your churn rate
The highest-ROI churn reduction moves depend on which type of churn is driving your number:
For involuntary churn (payment failures)
- →Set up a dunning email sequence (day 0, 3, 7, 10, 13)
- →Enable smart payment retries based on decline reason codes
- →Send expiring card alerts 2–3 weeks before expiry
- →Add backup payment method capture to your dunning flow
- →Run win-back campaigns 30–60 days after lapse
For voluntary churn (product/value)
- →Deploy a cancel flow with pause, discount, and plan change offers
- →Run exit surveys to understand the actual cancellation reason
- →Improve onboarding for the highest-churn cohorts
- →Move high-risk customers to annual billing (annual subscribers churn at 2–4× lower rates)
- →Add renewal reminders to re-establish value before the billing date
Find out how much of your churn is involuntary
Connect Stripe in 5 minutes. MRRescue runs a free diagnosis showing exactly how much MRR you're losing to failed payments.
Run free diagnosis →Related reading
How to Reduce Involuntary Churn
The 8-tactic playbook for recovering failed payments
What is dunning?
The complete guide to dunning for SaaS founders
Best Dunning Software in 2026
Tool comparison by price, features, and company stage
MRRescue: Cancel Flow
Intercept voluntary cancellations before they happen
SaaS Cancel Flow Guide
Pause offers, exit surveys, and the exact save sequence
Stripe Decline Codes
Why payments fail and how to recover each type
Frequently asked questions
What is a good SaaS churn rate?
For B2B SaaS, annual churn below 5% is generally considered good; below 3% is excellent. For SMB-focused SaaS, 5–10% annually is typical. For enterprise SaaS, under 5% is the standard benchmark. Consumer/PLG SaaS has higher benchmarks — 10–20% annually is common depending on price point.
What's the average monthly churn rate for SaaS?
The average monthly churn rate for B2B SaaS is approximately 0.5–1% per month, equating to 6–12% annually. High-growth, SMB-focused SaaS often runs 1–2% monthly. Enterprise SaaS typically sees 0.25–0.5% monthly churn.
What's the difference between gross churn and net churn?
Gross churn measures the percentage of MRR lost from cancellations and downgrades in a period, ignoring expansion revenue. Net revenue retention (NRR) or net churn accounts for expansion revenue from upsells and cross-sells. A company with 10% gross churn but 20% expansion revenue would have negative net churn — meaning it's growing from existing customers even while losing some.
How much of SaaS churn is involuntary?
Studies consistently estimate that 20–40% of subscription cancellations are involuntary — caused by payment failures rather than deliberate customer decisions. This means that in a company with 5% annual churn, 1–2 percentage points may be recoverable with proper dunning and payment recovery tooling.
Is 10% monthly churn too high?
10% monthly churn is extremely high for established SaaS — it would mean losing approximately 70% of revenue annually. For early-stage companies still finding product-market fit, higher churn is expected, but anything above 3–5% monthly warrants immediate investigation into both the product experience (voluntary churn) and payment recovery systems (involuntary churn).
Fix the recoverable part of your churn today
MRRescue recovers failed payments, prevents expiry-related lapses, and saves subscriptions at the cancel intent stage. Free 14-day trial — no credit card required.
Start free →